
Background
As petroleum professionals continue to refine their production processes, products such as crude oil can contain higher concentrations of problematic metals like nickel (Ni), iron (Fe), and vanadium (V). In the face of tightening regulations and increased demand for sweeter crudes, refiners are looking to buy lower cost oils that contain the metals mentioned above, with the intent of assessing their concentration levels throughout the refining process.
The reason these metals need to be continually monitored is due to their problematic effects on refining processes. For example, nickel and iron rapidly deactivate process catalysts used in hydrotreaters and FCC units which leads to off-specification coke and increased, unplanned costs to refiners. In addition to this, regulations for sweet crude will tighten in January 2019 to lower the allowable limit to 8ppm and 15ppm for nickel and vanadium, respectively. To compound the challenge of attaining a sweet crude and mitigating risk of damages from metals, refineries and other petroleum certification sites, such as terminals and third party labs, must adhere to regulations that require them to utilize D5708B methodology, which specifies ICP analysis. There is, however, an option for users to screen samples before ICP using XRF analysis.As mentioned, there are two well-known methods for elemental analysis: X-ray fluorescence (XRF), and inductively coupled plasma (ICP). In ICP measurements in compliance with method D5708B, also known as Inductively Coupled Plasma Optical Emission Spectroscopy (ICP – OES), samples must be digested with sulfuric acid, constantly stirred under gentle heat, then burned off in a muffle furnace to remove the carbon. After this, the sample must be reconstituted with nitric acid before finally being analyzed. ICP analysis is a highly precise form of elemental quantification, however, it involves exhaustive sample preparation and lengthy wait times for results – usually between 6 to 12 hours.
XRF analysis involves exposing the sample to X-rays to produce an emission at an energy level that is characteristic of the element of interest. This method involves minimal sample preparation and provides results in minutes. Energy DIspersive X-ray Fluorescence (EDXRF) is an improved version of the XRF technique. EDXRF applies state-of-the-art monochromating and focusing optics enabling a dramatically higher signal-to-background ratio. This technique also reduces background noise delivering lower limits of detection and significantly better precision.
Challenge
While professionals in the petroleum industry must adhere to the D5708B method, those looking to save downtime during the process may consider EDXRF as a cost-effective, in-house alternative. While some may utilize an in-house ICP setup, many professionals, such as those working at pipelines, have to send samples out. This is yet another necessary burden these professionals must deal with as the costs and downtime will ramp up significantly when products come back from ICP analysis out of spec. By testing in-house and getting results in less than five minutes, refineries, terminals, and labs will be able to make real-time decisions when products are off-spec and can improve their overall processes when products are within spec.
Solution
Those tethered to ICP can still utilize EDXRF for screening purposes. By utilizing Petra MAX in-house, powered by EDXRF, users can pre-screen their samples before sending them out for ICP testing. Likewise, even those with access to an in-house ICP process can save hours by first screening the samples with Petra MAX, then running off-spec or near off-spec with ICP. In this paper we will review and discuss data that covers elemental analysis across ICP and EDXRF methods with an emphasis on comparing the precision performance between the two.
RELATED: Precision Comparison Case Study — Petra MAX (EDXRF®) vs ICP (IP 501 & IP 621)
Testing Precision
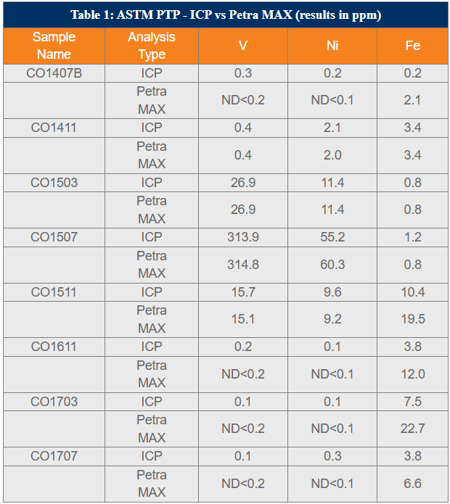
ASTM runs a Proficiency Testing Program (PTP) where they send out samples of crude oil several times per year to be tested at independent labs and refineries around the world. The results are then published which includes statistics on many test results, such as the average concentration values for Ni, V and Fe by ICP - see Table 1. XOS obtained sample retains from eight different PTPs and tested these samples on different Petra MAX analyzers.
Each crude oil sample was homogenized and then pipetted into a sample cup. The cup was sealed with a sample film and then vented before analysis with Petra MAX. Analysis time for each sample was five minutes, and the results were averaged; see Table 1.
Conclusion
EDXRF delivers comparable results to ICP in five minutes or less. In addition, users have minimal sample preparation and can achieve results with the push of a button. Those looking to save time and money in elemental quantification by screening samples before ICP analysis can achieve comparable results with Petra MAX.
Product Highlight: Petra MAX/Petra%20MAX%20on%20white.jpg?width=327&height=327&name=Petra%20MAX%20on%20white.jpg)
Rapid sulfur measurement plus 12 other critical elements
Petra MAX delivers advanced elemental analysis powered by EDXRF, utilizing XOS patented doubly curved crystal optics coupled with a high-performance silicon drift detector and an intense monochromatic excitation beam. This industry leading technology reduces background noise and increases signal-to-noise output, enabling low detection limits and high precision. Petra MAX offers low-level detection of iron, saving the marine industry money on engine replacement and lube oil costs, while also using a next-generation interface that saves users time.

A Unique Sample Introduction System to Eliminate Centrifuge
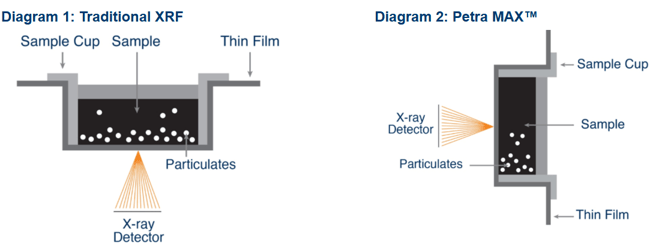
Particulate solids and water have shown to cause underreported sulfur measurements by as much as 40%. Such a significant error can cause misclassification of sour crude oil as sweet crude oil. With global regulatory trends lowering sulfur levels in refined products from diesel to marine fuel, underreporting sulfur may cause refiners to miscalculate the costs associated with processing incoming crude oil. Many D4294 analyzers are designed with the X-ray detector focused on the bottom of a sample cup where settling occurs, as depicted in Diagram 1. Since particulate solids and water settle over time, it is difficult to obtain accurate sulfur measurements due to the changing concentration of interferences. Because traditional D4294 XRF instruments take their measurement from the bottom of the sample, settling occurs at the focal point of the analysis rendering the analyzer’s automatic interference correction, ineffective. To prevent biased results, many laboratories centrifuge all crude oil samples prior to analysis by traditional D4294 instruments. This increases the amount of processing and time it takes to perform the measurement. To combat the effects of settling in crude oil, Petra MAX delivers a new, innovative sample chamber that rotates the sample on its side, providing a clear measurement window for more accurate results. See Diagram 2.
New Gen 4 Software Offers an Advanced Workflow
The new Gen 4 software upgrade for Petra Series offers novel features for a simple, intuitive operation including preset measurement configurations, streamlined custom calibration set-up, enhanced LIMS compatibility, and additional matrices like water and catalysts.
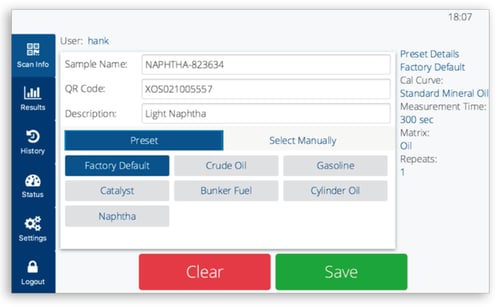
To match the expanding measurement capabilities of Petra Autosampler, users will now be able to set unique preset measurements with adjustable parameters for quick access to pre-determined measurement types. For example, a terminal frequently running crude oil samples can set a crude oil preset which includes a 300s measurement time, a preselected matrix type and calibration curve, and a default number of sample repeats - see Figure 1. Additionally, this preset can be set as the default measurement. The presets can be set directly after users scan their QR-coded cup or sample bottle with a single push of a button before loading the sample into the analyzer. All this information can be found on the main scan screen to reinforce the high throughput and efficient workflow that Petra offers.
Once a sample begins its measurement, live results will begin to populate for the elements of interest. Users can continue to load samples, work with a different instrument, or view their historical results. When a sample is not being measured, completed measurements can be averaged on-screen using the built-in averaging function. When running repeats, results will be automatically averaged and viewable as a separate file without the need to export data. Those looking to export their data can do so either through their network, USB drive, or as a printable CSV or PDF.
%20vs%20ICP%20(IP%20501%20%26%20IP%20621).png?width=600&height=323&name=Precision%20Comparison%20Case%20Study%20%E2%80%94%20Petra%20MAX%20(EDXRF%C2%AE)%20vs%20ICP%20(IP%20501%20%26%20IP%20621).png)

%20vs.%20XRF%20(D8252)%20for%20Ni%20and%20V.png?width=600&height=323&name=ASTM%20Crude%20Oil%20Proficiency%20Testing%20Program%20ICP%20(D5708B)%20vs.%20XRF%20(D8252)%20for%20Ni%20and%20V.png)
