- Analyzers
- Optics & Sources
- Technologies
- Support
- About
Are You Ready for the New ASTM D8252 Ni & V Method Using XRF?
Background
To meet the increased demand for finished product while consistently improving overall profitability, refineries and terminals are dealing more and more with opportunity crudes. This trend is expected to continue alongside heavy growth in overall refining capacity. According to Hydrocarbon Processing’s Industry Outlook: 2019 Update, there are a reported 415 CAPEX projects globally aimed at increasing overall refining capacity to process opportunity crudes1.
The inherent challenge in dealing with opportunity crudes is not just the increased sulfur content, but the presence of nickel and vanadium at higher concentrations than found in sweeter crude streams. Nickel and vanadium are problematic due to their impact on refining process efficiency. These elements rapidly deactivate the catalysts that are used in the catalytic cracker (FCC) and hydrotreater units.
How is the industry responding?
- First, NYMEX amended rule 200101 to add additional specifications for incoming contracts with a delivery date on or after January 2019. Among these specifications are nickel and vanadium concentration thresholds. These maximum concentrations are 8 ppm for nickel and 15 ppm for vanadium.
- Second, the American Society for Testing and Materials Committee D02 on Petroleum Products, Liquid Fuels,and Lubricants approved a new test method for X-ray Fluorescence (XRF) analysis of nickel and vanadium incrude and residual oil to assist petroleum professionals in the laboratory environment in certifying their products: ASTM D8252.
Throughout this paper, we will review ASTM D8252 method compliance criteria, and compare data run on XOS Petra analyzers with the method’s precision statements.
ASTM D8252 Method Highlights
ASTM D8252 allows for multiple XRF technologies to be used to provide immediate method compliance to those who have historically used XRF as a prescreen for Inductively Coupled Plasma Mass Spectroscopy (ICP) (ASTM D5708B). ASTM D8252 includes both wavelength dispersive XRF (WDXRF) and energy dispersive XRF (EDXRF) (Section 1.3), as well as polychromatic or monochromatic excitation (Sections 4.5.1 and 4.6.1)4. The Petra analyzers used in the study below utilize EDXRF with monochromatic excitation, also known as HDXRF®—XOS’ branded technology, which allows for increased precision and superior performance over traditional EDXRF analyzers. Please see the Technology Brief section at the end of this paper to learn more.
In Table 1 of this paper and the method, we can see the method range is from the pooled limit of quantitation (PLOQ), 1.9 ppm vanadium and 2.2 ppm nickel, to 50 ppm. The PLOQ is the “numerical limit at or above which the test results are considered to be quantitatively meaningful for commerce or regulatory activities” 2 . Therefore, D8252 aligns well with the NYMEX amended rule maximums. It should be noted that the PLOQs for this method are below the precision concentration ranges listed in the precision section of the ICP D5708 test method, which are 50-500 ppm and 10-100 ppm for vanadium and nickel, respectively. Note also that these ICP concentration ranges are above the NYMEX amended rule maximums.
| Table 1 – D8252 Elements & Ranges | ||
|---|---|---|
| Element | PLOQ (ppm) | Max Concentration (ppm) |
| Vanadium | 1.9 | 50 |
| Nickel | 2.2 | 50 |
WHY XRF?
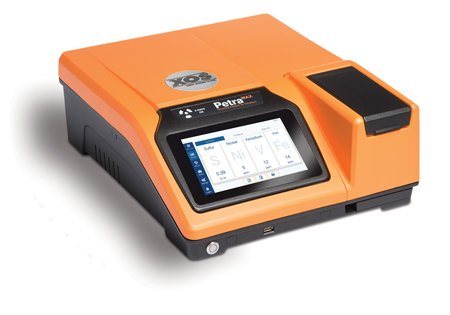
Historically, quantification of nickel and vanadium was performed by ICP analysis. ICP analysis can be demanding on the lab environment not only regarding time consumption, but also operator skill level. ICP analysis by ASTM D5708B requires rigorous sample preparation involving acid digestion and can take anywhere from 6 to 12 hours to complete a measurement. With an increasing demand for timely results alongside crude processing capacity, as well as the need to quickly onboard new and existing lab talent, refineries have looked to streamline their measurement processes to reduce time and lower the expertise threshold to meet their unique needs. Petra MAX analysis is well equipped to meet these needs as measurement takes as little as 5 minutes and sample preparation being quick to master. This measurement process is detailed in D8252 under Section 13 Procedure, and we will review this in more detail further into the paper.
Visit xos.com/resource-petroleum to find more XOS technical papers, like HDXRF vs ICP for Ni & V in Crude Oil. Read a short summary about this paper at the end of this method brief.
METHOD PRECISION
As with other ASTM methods, the precision statement in the method is a result of the Interlaboratory Study (ILS), which is detailed in Section 16.1: “The ILS was conducted in 2017 and included 15 laboratories analyzing 22 samples in duplicate for nickel and 10 laboratories analyzing 16 samples in duplicate for vanadium. The participating laboratories used a combination of best-fit regression calibration and matrix effects corrections based on best-fit regression, FP or theoretical alphas4 .”
Calculated values from the resulting precision are detailed in Tables 2 and 3 of this paper. As a quick review, the difference between repeatability (r) and reproducibility (R) is as follows5 :
- REPEATABILITY (r) is defined as the difference between repetitive results obtained by the same operator in a given laboratory, applying the same test method with the same apparatus, under constant operating conditions, on identical test material and within short intervals of time, would in the long run and in the normal and correct operation of the test method, exceed the value calculated only once in 20 measurements (5% of the time). Or more simply put, repeatability is the maximum expected difference (at 95% confidence) between two measurement results run on the same material using the same apparatus, test method, and operator.
- REPRODUCIBILITY (R) is the difference between two single independent results obtained by different operators, applying the same test method in different laboratories, using different apparatus on identical test material, would in the long run and in the normal and correct operation of the test method, exceed the value calculated only once in 20 measurements (5% of the time). Or, reproducibility is the maximum expected difference (at 95% confidence) between two measurements taken on the same material using the same test method by two different laboratories each using a different apparatus and operator.
| Table 2 – D8252 Calculated Repeatability Values | ||
|---|---|---|
| Concentration | V (ppm) | Ni (ppm) |
| 3.0 | 0.8 | 0.8 |
| 5.0 | 1.0 | 1.1 |
| 10.0 | 1.5 | 1.5 |
| 25.0 | 2.4 | 2.5 |
| 50.0 | 3.5 | 3.6 |
| Table 3 – D8252 Calculated Reproducibility Values | ||
|---|---|---|
| Concentration | V (ppm) | Ni (ppm) |
| 3.0 | 3.1 | 2.6 |
| 5.0 | 4.0 | 3.4 |
| 10.0 | 5.8 | 4.8 |
| 25.0 | 9.3 | 7.8 |
| 50.0 | 13.4 | 11.3 |
To purchase the new ASTM D8252 test method, please visit www.astm.org

HDXRF PRECISION & ENSURING COMPLIANCE
To assess the precision of Petra MAX powered by HDXRF, two studies were performed:
- repeatability and accuracy study of Petra MAX at 10 ppm using a known Ni and V in mineral oil check sample
- reproducibility and accuracy of multiple Petra MAX analyzers using known and unknown Ni and V in crude oil samples
Table 4 contains repeatability data run for a mineral oil check sample—we ran this data to showcase not only repeatability but also the accuracy of Petra MAX analyzer using a 10 ppm Ni and V in mineral oil sample. Ten separate aliquots were prepared using the sample preparation procedure outlined below in the reproducibility study, and each aliquot was measured for 300s each using the Petra MAX Autosampler. The average of ten determinations of the 10 ppm sample was 9.98 ppm and 9.63 ppm for Ni and V respectively. The standard deviations were 0.07 ppm for Ni and 0.09 ppm for V. If a guideline of 2.8 times the standard deviation is used, repeatability for this Petra MAX analyzer can be estimated as 0.20 ppm for Ni and 0.25 ppm for V, which is well within D8252 calculated repeatability of 1.5 ppm.
| Table 4 – 10 ppm in Mineral Oil Repeatability Study Results | ||
|---|---|---|
| Determination | Ni (ppm) | V (ppm) |
| 1 | 9.97 | 9.64 |
| 2 | 9.84 | 9.60 |
| 3 | 10.00 | 9.69 |
| 4 | 10.06 | 9.81 |
| 5 | 9.95 | 9.64 |
| 6 | 9.96 | 9.51 |
| 7 | 9.93 | 9.60 |
| 8 | 10.05 | 9.60 |
| 9 | 10.05 | 9.51 |
| 10 | 9.96 | 9.66 |
| Average | 9.98 | 9.63 |
| Std Dev | 0.07 | 0.09 |
| %RSD | 0.67% | 0.91% |
In the reproducibility study, four crude oil samples were analyzed:
- Custom doped crude oil standard from VHG Labs containing 8 ppm Ni and 14 ppm V
- Sour crude oil retain from Intertek
- Medium sour crude retain from Crudemonitor.ca
- Heavy sour crude retain from Crudemonitor.ca
Three independent laboratories analyzed the sample set using different Petra MAX analyzers. Each participant received two randomized sample sets packaged in blind duplicate for analysis. Samples were prepared by first shaking the sample to homogenize it. Using a disposable pipette, 7 to 10 mL of sample is transferred to a disposable plastic sample cup designed for XRF analysis. An X-ray transparent film is then placed over the opening of the cup and affixed using a snapon ring. Finally, the sample is placed in the instrument and is ready for analysis. This process, from sample preparation to results, takes about 6 minutes. The resulting raw data sample means and standard deviations can be seen in Table 5.
| Table 5 – Reproducibility Study Results | ||||
|---|---|---|---|---|
| Sample | Ni (ppm) | Ni Std Dev | V (ppm) | V Std Dev |
| A | 8.7 | 0.1 | 14.3 | 0.3 |
| B | 5.6 | 0.1 | 16.7 | 0.3 |
| C | 12.7 | 0.1 | 29.9 | 0.2 |
| D | 45.3 | 0.1 | 100.4 | 1.2 |
The average Ni result on sample A was 8.7 ppm compared to the 8 ppm doped value, and 14.3 ppm V average as compared to the 14 ppm doped value, indicating good accuracy. Samples B-D were unknown crude oil samples, and if we use the 2.8 times standard deviation guideline as before, we can see that samples B and C are well within D8252 method reproducibility, as is sample A. Sample D is outside the D8252 scope, but reproducibility on this sample is also is very good.
CONCLUSION
With the ever-increasing need to measure incoming crudes as quickly and efficiently as possible, the industry has responded with a new test method. To ensure compliance with the method and low levels of both nickel and vanadium, a highly precise XRF analyzer will become a critical piece of equipment in the lab environment. From the data shown in this study, Petra MAX analyzers demonstrate excellent analytical performance while ensuring compliance with ASTM Method D8252. In addition, sample preparation to results is typically 6 minutes or less, and non-technical users can learn how to use the analyzer quickly. Therefore, with minimal sample preparation and rapid results, Petra MAX is a viable solution for petroleum laboratories.
Petra MAX delivers D4294 sulfur analysis alongside rapid measurement of 12 other elements including D8252 analysis of nickel and vanadium. Petra is powered by HDXRF which delivers higher performance over traditional EDXRF
Petra MAX analyzers can provide lab professionals with ultra-low limits of detection for both nickel and vanadium by utilizing doubly curved crystal optics. This allows operators to detect low limits for critical elements without the assistance of a vacuum pump or the usage of consumable gasses. The detection limits for both elements as well as sulfur and iron are shown in Table 6.
| Table 6 – Petra MAX Limits of Detection (600s) | |||
|---|---|---|---|
| Sulfur (ppm) | Nickel (ppm) | Vanadium (ppm) | Iron (ppm) |
| 5.7 | 0.04 | 0.10 | 0.07 |
Additionally, Petra analyzers now come with the option for an autosampler add-on, utilizing a unique vertical sample slide that allows for one-of-a-kind continuous sample loading. Petra boasts updated software featuring customized measurement presets, several data output settings, on-screen averaging, and more. These analyzers also allow users to work within a wide variety of applications by measuring all 13 elements in hydrocarbon matrices including crude oil, naphtha, gasoline, and jet fuel, as well as water, catalyst, and petroleum coke samples.
Technology Brief: HDXRF
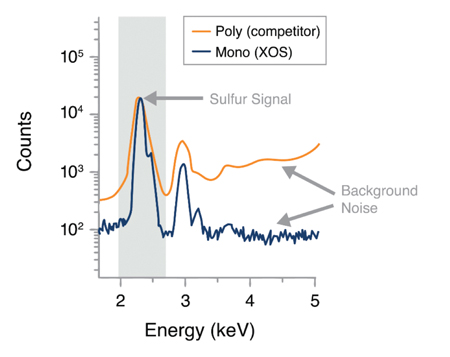
HDXRF is an elemental analysis technique that offers significantly enhanced detection performance over traditional EDXRF technology by applying state-of-the-art monochromating and focusing optics. These optics make for dramatically higher signal-to-background ratios compared to ratios resulting from polychromatic X-ray fluorescence. Figure 1 showcases the use of focused monochromatic excitation within the configuration of an HDXRF-equipped analyzer. Figure 2 compares the detector signal of polychromatic (competitor) with monochromatic (XOS) XRF to demonstrate how monochromatic excitation reduces background noise and improves signal definition, delivering lower limits of detection and dramatically better precision.
Figure 1: HDXRF Technology
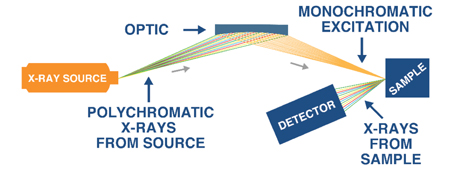
Figure 2: Superior Signal-to-Noise Ratio
HDXRF vs ICP Summary
In the paper HDXRF vs ICP for Ni & V in Crude Oil, a study is conducted to compare the precision of Petra MAX with ICP. This is the same study using samples A-D as mentioned above, and we will summarize the results.
First, let’s review the ICP sample preparation process from the study. ICP performed by ASTM method D5708B requires extensive sample preparation when analyzing crude oil. The crude oil sample is digested with sulfuric acid and heat, using both an infrared lamp and a hotplate until the sample has been reduced to a carbonaceous ash. This ash is then carefully transferred to a muffle furnace and all of the carbon s burned away. The remaining material is then reconstituted with nitric acid, and the sample is then ready for analysis. Users report that this process of sample preparation to results takes anywhere from 8 to 12 hours to complete.
The results show that HDXRF (Petra MAX) demonstrates good correlation with ICP for nickel and vanadium in crude oil with HDXRF delivering better precision and lower variability as shown in Table 7 by HDXRF’s lower standard deviation. In addition, HDXRF sample preparation to results can be completed in just minutes compared to the 8 to 12 hours for ICP
| Table 7 – HDXRF vs ICP Reproducibility Study Results | ||||||||
|---|---|---|---|---|---|---|---|---|
| HDXRF | ICP | |||||||
| Sample | Ni (ppm) | Ni Std Dev | V (ppm) | V Std Dev | Ni (ppm) | Ni Std Dev | V (ppm) | V Std Dev |
| A | 8.7 | 0.1 | 14.3 | 0.3 | 7.4 | 3.2 | 14.2 | 3.8 |
| B | 5.6 | 0.1 | 16.7 | 0.3 | 5.2 | 3.1 | 17.9 | 8.2 |
| C | 12.7 | 0.1 | 29.9 | 0.2 | 12.4 | 4.4 | 31.5 | 9.9 |
| D | 45.3 | 0.1 | 100.4 | 1.2 | 30.5 | 23.0 | 73.9 | 45.1 |
REFERENCES:
- Hydrocarbon Processing Industry Outlook: 2019 Update, Webcast https://www.hydrocarbonprocessing.com/resources/webcasts
- ASTM D6259-15(2019), Standard Practice for Determination of a Pooled Limit of Quantitation for a Test Method, ASTM International, West Conshohocken, PA, 2019, www.astm.org
- ASTM D5708-15, Standard Test Methods for Determination of Nickel, Vanadium, and Iron in Crude Oils and Residual Fuels by Inductively Coupled Plasma (ICP) Atomic Emission Spectrometry, ASTM International, West Conshohocken, PA, 2015, www.astm.org
- ASTM D8252-19, Standard Test Method for Vanadium and Nickel in Crude and Residual Oil by X-ray Spectrometry, ASTM International, West Conshohocken, PA, 2019, www.astm.org
- ASTM D6300-19, Standard Practice for Determination of Precision and Bias Data for Use in Test Methods for Petroleum Products and Lubricants, www.astm.org

Author:
Leslie Johnson, Applications Scientist