- Analyzers
- Optics & Sources
- Technologies
- Support
- About
Ensure Accurate Results for Sulfur & Chlorine Analysis in Biodiesels
Background
The use of biodiesel is rapidly becoming more popular due to growing trends both inside and outside the petroleum industry. The U.S. Energy Information Administration shows that production of biodiesel has increased by over 100 million gallons per month since 2011, with biodiesel making up 4% of total diesel consumption in 20161. Responding to the evolving industry and social landscape, many traditional refineries have begun to incorporate biodiesel into their finished products.
Biodiesels naturally contain little sulfur, reduce soot emissions, and have a more pleasant odor than diesel fuel. Biodiesels are commonly blended with petroleum-based diesels to improve cold-weather performance and reduce compatibility issues with compression-ignition engines2. Biodiesels and their feedstocks contain sulfur and chlorine, and therefore refineries must comply with sulfur regulations and monitor chlorine to protect equipment from corrosion. This elemental analysis will require a high level of precision and accuracy to ensure that concentrations are reported correctly.
Challenge
Typical biodiesels are known to have an oxygen concentration which is higher than that of traditional diesels. This high oxygen content (most commonly between 9 – 11 wt%) can cause XRF analyzers to report lower sulfur and chlorine concentrations due to absorption of the XRF signal by the oxygen. To address this bias and ensure an accurate measurement, two techniques are recommended: applying a correction factor to the measurement results, or matrix matching the calibration standards to the oxygenated biofuel samples.
Solution
ASTM D7039 compliance testing using XRF analyzers is a proven technology that combines ease-of-use with high precision. This paper will investigate and discuss approaches to elemental analysis for biodiesel applications. These approaches will compensate for increased oxygen content in the sample product, while also complying with ASTM sulfur standards. By using Sindie +Cl, XRF benchtop analyzer, the user has the added benefit of testing both sulfur and chlorine with one instrument.
Figure 1: Sample Preparation
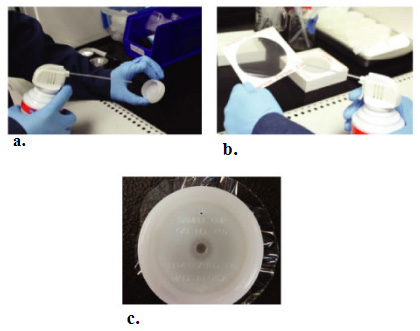
Compressed air is used to blow off any dust from a new standard XRF sample cup (a.) and the sample is transferred into the cup. Compressed air is used to clean the Etnom sample film (b.), and then the film is placed over the cup and secured with a plastic ring to make a flat, tight surface. The sample is placed face down on a lint-free cloth and a venting hole (c.) is created in the back of the cup. The sample is now ready for measurement.
Application Study
To demonstrate how Sindie +Cl can be used to quantify sulfur and chlorine in biodiesels, it’s important to first discuss the measurement bias introduced by the oxygen content, and then how matrix matching or correction factors can mitigate the effect. In this study, the analyzer was calibrated with a typical mineral oil calibration for both sulfur and chlorine, as mineral oil is commonly considered to be matrix matched for diesel applications. Two commercially-available biodiesel standards (B100) were selected, one with a sulfur concentration of 5 ppm, and the other with a chlorine concentration of 25 ppm. Samples were prepared following the steps illustrated in Figure 1. Eleven separate aliquots of each sample type were measured for 300 seconds each to assess the repeatability of Sindie +Cl and to illustrate the bias effect when biodiesel is measured on a mineral oil calibration. Next, correction factors and matrix matching are used to show how this effect can be mitigated.
Results
When running 5 ppm sulfur in biodiesel on a standard mineral oil calibration curve, the resulting average is biased low, 4.19 ppm ( Table 1, Column 2). Similarly, the 25 ppm chlorine biodiesel was also biased low, 20.37 ppm ( Table 2, Column 2). These low biases correspond to the higher than normal oxygen content discussed above, with higher oxygen content leading to more negatively biased results. Correction factors were then used for both sulfur and chlorine to mitigate this bias.
ASTM D7039 methodology offers a way to calculate correction factors for oxygen content. Sindie +Cl complies with both D7039 and D2622, and the correction factors defined in D7039 can be used during D2622 mode as the analyzer geometry does not change.
| Table 1: 5 ppm Sulfur in Biodiesel | |||
|---|---|---|---|
| Repeat | Uncorrected (Mineral Oil Calibration) |
Corrected (Mineral Oil Calibration) |
Matrix Matched (B100 Calibration) |
| 1 | 4.35 | 5.18 | 4.82 |
| 2 | 3.96 | 4.72 | 4.39 |
| 3 | 4.29 | 5.11 | 4.75 |
| 4 | 4.04 | 4.81 | 4.46 |
| 5 | 4.16 | 4.96 | 4.61 |
| 6 | 4.15 | 4.94 | 4.59 |
| 7 | 3.98 | 4.74 | 4.39 |
| 8 | 3.99 | 4.75 | 4.40 |
| 9 | 4.52 | 5.39 | 5.03 |
| 10 | 4.30 | 5.12 | 4.77 |
| 11 | 4.36 | 5.19 | 4.84 |
| Average | 4.19 | 4.99 | 4.64* |
| Standard Deviation | 0.19 | 0.22 | 0.22 |
| Relative Standard Deviation | 4.45% | 4.45% | 4.68% |
| Correction Factor | N/A | 1.1914 | N/A |
*Results indicate that although both the sample and calibration were B100, the oxygen content of calibration standards and test sample were not identical.
| Table 2: 25 ppm Chlorine in Biodiesel | |||
|---|---|---|---|
| Repeat | Uncorrected (Mineral Oil Calibration) |
Corrected (Mineral Oil Calibration) |
|
| 1 | 20.60 | 24.64 | |
| 2 | 20.41 | 24.41 | |
| 3 | 20.32 | 24.30 | |
| 4 | 20.26 | 24.23 | |
| 5 | 20.24 | 24.21 | |
| 6 | 21.04 | 25.17 | |
| 7 | 20.16 | 24.11 | |
| 8 | 19.94 | 23.85 | |
| 9 | 19.60 | 23.44 | |
| 10 | 20.64 | 24.69 | |
| 11 | 20.86 | 24.95 | |
| Average | 20.37 | 24.36 | |
| Standard Deviation | 0.41 | 0.49 | |
| Relative Standard Deviation | 2.01% | 2.01% | |
| Correction Factor | N/A | 1.1961 | |
The use of correction factors requires the user to know how much oxygen (wt%) is in the sample. Differing oxygen contents in the biodiesel samples will require different correction factors. As noted in ASTM D7039 section 5.2.1, oxygen correction factors for sulfur in biodiesel can be found in Table 2 of the method ( Table 3 in this paper) or calculated using Annex A1. Refer to the Table 3 note for obtaining the correction factor that corresponds to the oxygen content in the measured sample. For example, 11 wt% oxygen corresponds to a correction factor of 1.1914. Apply the correction factor by multiplying the uncorrected measured value (reported by the analyzer) by the correction factor to obtain the oxygen corrected value. Oxygen correction factors for chlorine in biodiesel are not included in the D7039 sulfur method, but they were calculated using the same principles as the D7039 Annex A1 calculations. Table 4 is used in the same manner as the sulfur table. For example, the correction factor for chlorine in a biodiesel sample having 11 wt% oxygen is 1.1961.
The 5 ppm sulfur in biodiesel test sample contained 11 wt% oxygen, which as mentioned above, corresponds to a correction factor of 1.1914. After applying the correction factor, the resulting average was 4.99 ppm ( Table 1, Column 3), which effectively corrects the oxygen bias of the sample. The 25 ppm chlorine in biodiesel sample also contained 11 wt% oxygen, which as mentioned above, corresponds to a correction factor of 1.1961. When this correction factor is applied to the uncorrected results, it results in a corrected average concentration of 24.36 ( Table 2, Column 3), proving that correction factors can provide a simple and accurate method to measure sulfur and chlorine in biodiesel.
Correction factors are ideal for laboratories that run biofuels infrequently or don’t want to maintain multiple calibration curves for oxygenated and non-oxygenated samples. These correction factors will allow the user to run traditional diesel, biodiesel blends (e.g. B6-B20), and B100 samples on the same calibration curve instead of having three separate curves.
| Table 3: Oxygen Correction Factors for Sulfur in Biodiesel Measured on a Mineral Oil Calibration |
||||||||||
|---|---|---|---|---|---|---|---|---|---|---|
| Oxygen, wt % | 0% | 1% | 2% | 3% | 4% | 5% | 6% | 7% | 8% | 9% |
| 0% | 1.0000 | 1.0174 | 1.0348 | 1.0522 | 1.0696 | 1.0870 | 1.1044 | 1.218 | 1.1392 | 1.1566 |
| 10% | 1.1740 | 1.1914 | 1.2088 | 1.2262 | 1.2436 | 1.2610 | 1.2784 | 1.2958 | 1.3132 | 1.3306 |
NOTE: To determine the appropriate correction factor, select the row that matches the most significant figure of the oxygen concentration, and then find the column that matches the least significant figure. The intersection of the row and column is the correction factor. For example, a sample with an oxygen concentration of 11 wt% would use a correction factor of 1.1914. The correction factor is applied by multiplying the measured result by the correction factor to obtain the oxygen corrected sulfur value.
| Table 4: Oxygen Correction Factors for Chlorine in Biodiesel Measured on a Mineral Oil Calibration |
||||||||||
|---|---|---|---|---|---|---|---|---|---|---|
| Oxygen, wt % | 0% | 1% | 2% | 3% | 4% | 5% | 6% | 7% | 8% | 9% |
| 0% | 1.0000 | 1.0178 | 1.0357 | 1.0535 | 1.0713 | 1.0891 | 1.1070 | 1.1248 | 1.1426 | 1.1604 |
| 10% | 1.1783 | 1.1961 | 1.2139 | 1.2318 | 1.2496 | 1.2674 | 1.2852 | 1.3031 | 1.3209 | 1.3387 |
NOTE: Similar to Table 3, to determine the appropriate correction factor, select the row that matches the most significant figure of the oxygen concentration, and then find the column that matches the least significant figure. The intersection of the row and column is the correction factor. For example, a sample with an oxygen concentration of 11 wt% would use a correction factor of 1.1961. The correction factor is applied by multiplying the measured result by the correction factor to obtain the oxygenated corrected chlorine value.
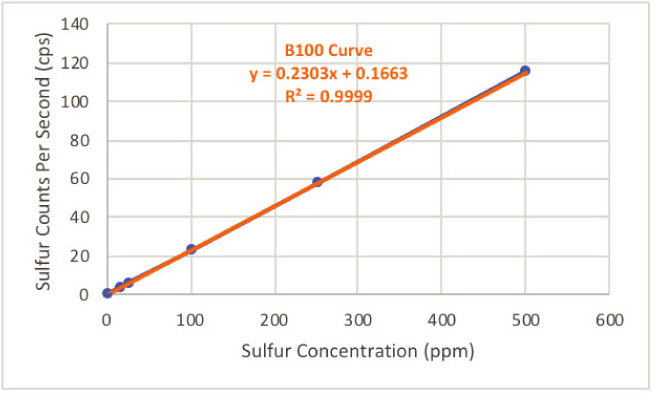
In addition to use of correction factors, a sulfur in biodiesel (B100) calibration was set up to determine the effect of matrix matching as a means to correct for the oxygen content in the biodiesel sample. A commercially available calibration set of 0-500 ppm sulfur in biodiesel standards was obtained from a different supplier. See Figure 2 for calibration results. The calibration was extremely linear, resulting in a correlation coefficient (R2) of 0.9999 which provides a high degree of confidence over the full calibration range for any measurements with a similar matrix. Matrix matching is ideal for laboratories that exclusively run biodiesel samples which have a similar oxygen content, or for laboratories who wish to avoid potential errors that may occur as a result of incorrect application of correction factors or transcription errors.
When the 5 ppm sulfur in biodiesel sample is measured on the matrix matched calibration curve, the resulting average was 4.64 ppm ( Table 1, Column 4). Note that matrix matching reduced the bias but did not eliminate it completely. This is because the biodiesel calibration standards and biodiesel test samples were ordered from two different standards vendors without specifying the oxygen content of the biodiesel samples. That is, both sets of samples were B100 samples, but the differing oxygen content of these samples meant that the matrix was not matched as well as it could be. Therefore, for best results when matrix matching oxygenated calibration standards to oxygenated test samples, ensure that the oxygen content of the two sample sets is the same.
Lastly, both sulfur and chlorine tests show a low relative standard deviation (RSD) which proves consistency and reliability of the MWDXRF technology. Users expect precision and accuracy from their measurements, and these results demonstrate this performance. MWDXRF analyzers utilize technology that the industry has relied on for years for highly precise elemental analysis. With various ways to correct for oxygen, professionals in the industry can now test levels of critical elements in their biodiesel products with highly accurate and easy to use MWDXRF analyzers.
Figure 2: Matrix Matched 0-500 ppm Sulfur in Biodiesel Calibration Curve
Conclusion
The need for refineries and biodiesel plants to test biodiesel for sulfur and chlorine content is critical for regulatory compliance and to protect from corrosion events. Incorporating an easy-to-use and precise elemental analyzer is key to ensuring success in a rapidly growing industry. To account for high oxygen content of biodiesel and potential low bias results when measured on a non-oxygenated calibration, the simple use of a correction factor or matrix matching is recommended to correct for this bias. Sindie +Cl delivers high precision measurements that fall within ASTM D7039 and ASTM D2622 guidelines without the need for exhaustive or expensive sample preparation for both sulfur and chlorine in biodiesels.
Sindie +Cl utilizes a technique known as Monochromatic Wavelength Dispersive X-ray Fluorescence (MWDXRF) – delivering exceptional precision. It delivers trace analysis for both sulfur and chlorine with one push of a button and zero hassle. Samples are measured directly, which means it can analyze even the heaviest of hydrocarbons like crude oil or coker residuals, without the hassle of boats, injectors, furnaces, or changing detectors. Sindie +Cl provides refineries, terminals, and third-party testing labs with an easy to use, highly precise elemental analyzer.