-
Analyzers
- Sulfur Analyzers
- Chlorine Analyzers
- Multi Element Analyzers
-
Parts and Supplies
Accessories PartsSupplies
- Service & Maintenance
- Optics & Sources
- Technologies
- Support
- About
Precision Comparison Between ASTM Test Methods D7039, D2622, and D5453
BACKGROUND
For many years, professionals in the petroleum industry have faced challenges regarding compliance and quality of product. These challenges are made more difficult by the variety of regulations and specifications, and the implications they present for their refining process. Regulators across the globe are moving to even more restrictive regulations on sulfur content in a variety of fuels with many countries now requiring maximum sulfur concentration in automotive fuels of 10 to 15 parts per million (ppm).
These regulations have furthered the need for refineries to maximize the precision of their sulfur analysis methodology. Desulfurization processes are expensive utilizing catalyst, hydrogen, and heat. By using a more precise sulfur measurement technique, refiners can produce product closer to the specification maximums, reducing giveaway and saving money. This savings is illustrated in Figure 1. In addition to production efficiencies, refiners can avoid inaccurate reporting which can lead to regulatory missteps and contract disputes by using a test method with better precision.
With several different methodology options for sulfur analysis available, refineries, terminals, and test inspection certification companies must take care to select a method that produces the least amount of variability in their measurements.
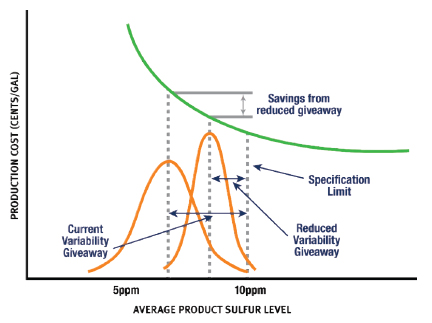
Figure 1: Savings From Improved Measurement Precision
ASTM conducts Proficiency Testing Programs (PTP) several times per year. In each PTP study, ASTM sends samples of hydrocarbon products or feedstocks to various participant sites. Each participating laboratory performs analyses following ASTM methods for various test parameters, including sulfur, using the samples provided. This paper will discuss the ASTM PTP sulfur results for Reformulated Gasoline (RFG) and Ultra Low Sulfur Diesel (ULSD) programs from 2023-2025 using the most common test methods for low sulfur automotive fuels: D7039, D2622, and D5453. First, an understanding of the test methods is critical to interpreting the data presented.
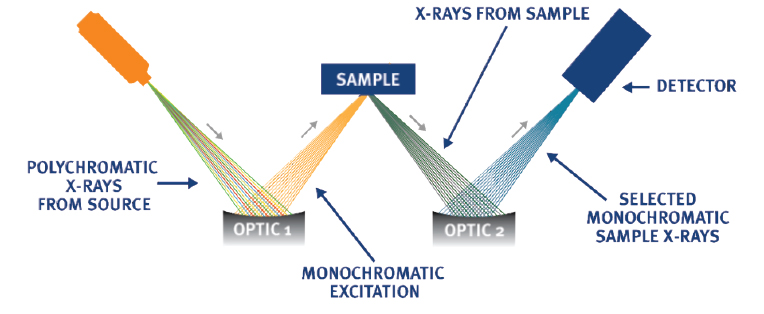
ASTM Method D7039 (Monochromatic Wavelength Dispersive X-Ray Fluorescence)
Monochromatic Wavelength Dispersive X-ray Fluorescence (MWDXRF) is a subset of WDXRF that utilizes similar principles. Rather than using filters or traditional crystals that are flat or singly curved, MWDXRF incorporates doubly curved crystal (DCC) optics to provide a focused, monochromatic excitation X-ray beam to excite the sample. A second DCC optic is used to collect the sulfur signal and focus it onto the detector. This modified methodology delivers a signal-to-background ratio that is 10-times more precise than traditional WDXRF, which improves method precision and Limit of Detection (LOD).
MWDXRF Diagram
ASTM Method D2622 (Wavelength Dispersive X-ray Fluorescence)
Wavelength Dispersive X-ray Fluorescence (WDXRF) is a type of X-ray Fluorescence, or XRF, which uses high-intensity X-rays to excite elements of interest within a sample. Upon exposure, fluorescent X-rays are emitted from the sample at energy levels that are unique to each element. Additionally, the background signal, an energy region not characteristic of sulfur or other interfering elements, is collected and subtracted from the sulfur signal to improve precision and LOD. To isolate the sulfur signal and to reduce noise, WDXRF utilizes a filter and a collection crystal before the sulfur signal reaches the detector. WDXRF also differs from MWDXRF in that it doesn’t specify excitation type (i.e. monochromatic OR polychromatic excitation), whereas MWDXRF specifies monochromatic excitation.
ASTM Method D5453 (Ultraviolet Fluorescence)
In Ultraviolet Fluorescence (UVF) technology, a hydrocarbon sample is either directly injected into a high temperature (1000°C) combustion furnace or placed in a sample boat that is cooled and then injected into the combustion furnace. The sample is combusted in the tube, and sulfur is oxidized to sulfur dioxide (SO2) in the oxygen-rich atmosphere. Water produced during the sample combustion is removed by a membrane dryer and the sample combustion gasses are exposed to ultraviolet (UV) light. SO2 is excited (SO2*), and the resulting fluorescence that is emitted from the SO2* as it returns to the stable state is detected by a photomultiplier tube. The resulting signal is a measure of the sulfur contained in the sample.
PRECISION & ILS RESULTS
Hundreds of participants are involved in the monthly ULSD PTP program, which exclusively looks at sulfur. The monthly RFG PTP boasts over a hundred participants running a variety of test methods for differing RFG parameters. The data shown represents sulfur data collected throughout the study from January 2023 to May 2025.
Understanding the Data (Mean Concentration and Reproducibility)
Both graphs and tables shown below track average sample concentration and reproducibility (R). Reproducibility is the difference between two single and independent results obtained by different operators applying the same test method in different laboratories using different apparatus on identical test material. A lower reproducibility value correlates to a better level of precision which can minimize risks from inaccurate reporting such as regulatory fines and contract disputes.
The data presented is filtered to show all samples whose average concentration ranged between 5 and 15 ppm. These values were chosen based on the most common regulatory requirements for sulfur content in automotive fuel in Europe, United States, China, and others around the world. It is critical for an analyzer to have low reproducibility values (better precision) when measuring these types of samples. When interpreting the data, keep in mind:
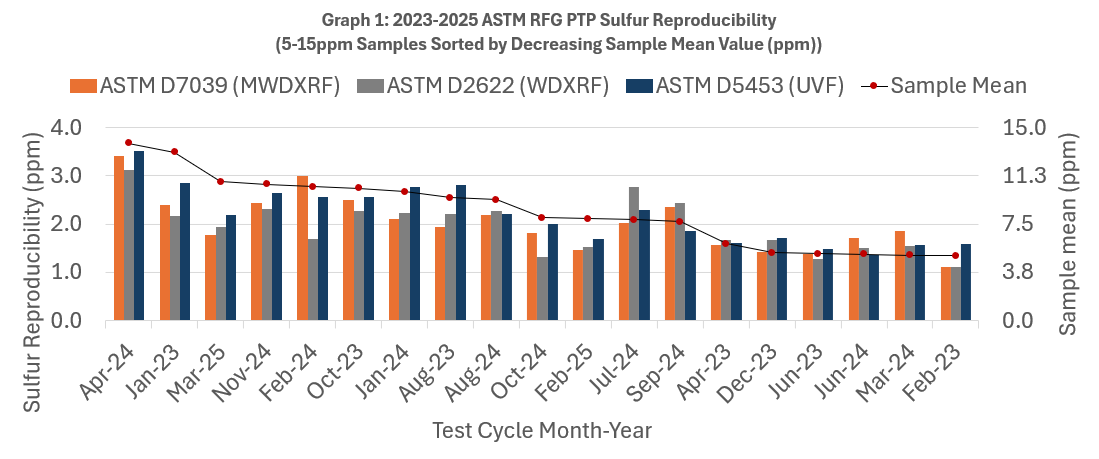
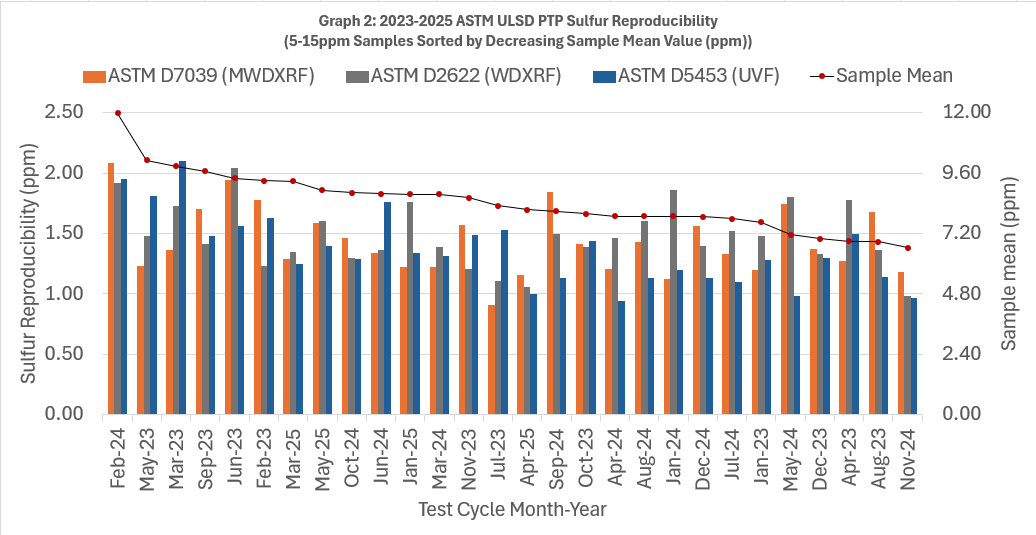
Graphs 1 & 2
- Both graphs are sorted by decreasing sample mean.
- Each column cluster in the graphs represents reproducibility for one sample measured by multiple laboratories each using D7039, D2622, or D5453.
- Within each column cluster, each color-coded bar corresponds to reproducibility for one test method. D7039 is in orange, D2622 is in gray, and D5453 is in blue.
- The numerical value of each method/bar is graphed on the left axis. (remember - lower R values are indicative of better precision).
- For many test methods, precision is often dependent on concentration. For context, the monthly average sulfur concentration is graphed as a red dot and its value is shown on the right axis of the graphs.
Tables 1 & 2
- Both tables are sorted by decreasing sample mean.
- Both tables are color-coded to indicate relative monthly performance; green represents the best method reproducibility, yellow represents the second best reproducibility, and red represents the poorest reproducibility.
The average R value across the 3 years of study data is the key performance indicator shown in both graphs and tables. A summary of the reproducibility of the RFG and ULSD PTP samples for 2023-2025 showed that ASTM D7039, using MWDXRF, had:
- The best precision for RFG 53% of the time compared to D2622
- The best precison for RFG 79% of the time compared to D5453
- The best precision for ULSD 57% of the time when compared to D2622
- The best precision for ULSD 36% of the time compared to D5453
Even though D5453 demonstrates better performance, when you look at the actual difference in reproducibility for the 5-15ppm data is only 0.3 ppm on average. This minimal variance suggests that the precision of D5453 and D7039 is fairly equivalent.
In the RFG PTP program, D7039 outperforms D2622 53% of the time, and outperforms D5453 79% of the time when evaluating samples with a mean sample concentration of 5 – 15 ppm.
In the ULSD PTP Program, D7039 out performs D2622 57% of the time, and better than D5453 36% of the time. Even though D5453 demonstrates better performance, when you look at the actual difference in reproducibility for the 5-15ppm data is only 0.3 ppm on average. This minimal variance suggests that the precision of D5453 and D7039 is fairly equivalent.
Table 1: RFG PTP Sulfur Reproducibility (5 – 15 ppm samples sorted by decreasing sample mean)
ASTM method D7039 D7039 outperforms D5453 79% of the time and outperforms method D2622 53% of the time.
Table 1: RFG PTP Sulfur Reproducibility (5-15ppm samples sorted by decreasing sample mean)
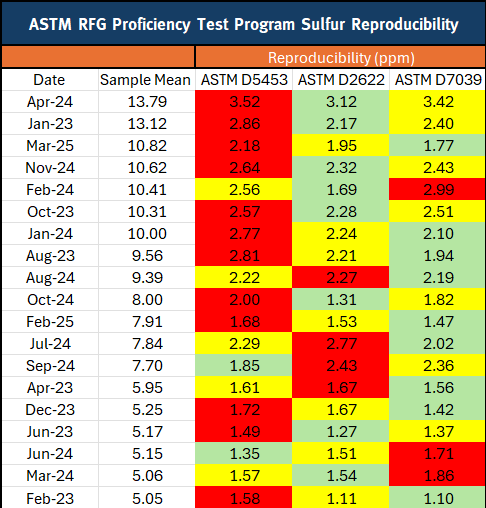
KEY
Green = Best Reproducibility
Yellow = Second Best Reproducibility
Red = Poorest Reproducibility
Table 2: ULSD PTP Sulfur Reproducibility
(5 – 15 ppm samples sorted by decreasing sample mean)
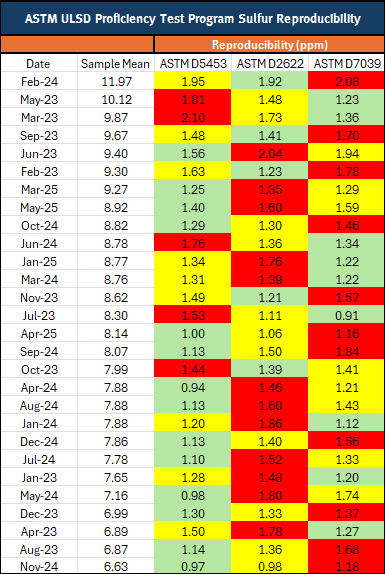
ASTM method D7039 outperforms D2622 57% of the time, and better than D5453 36% of the time. Even though D5453 demonstrates better performance, when you look at the actual difference in reproducibility for the 5-15ppm data is only 0.3 ppm on average. This minimal variance suggests that the precision of D5453 and D7039 is fairly equivalent.
In both Tables 1 and 2, test method D7039 contains most of the lower or equivalent R values which indicated better or equivalent PTP precision.
When measuring for critical elements such as sulfur, a highly precise testing method is vital. Low precision methods can lead to products being off spec which can costs refineries millions of dollars in fines, or product downgrading. Reducing variability in sulfur analysis is critical to reducing sulfur giveaway, and from the data shown, MWDXRF methods offer the highest or equivalent level of precision and reliability.
CONCLUSION
For any refinery, a simple, streamlined elemental analysis process with high precision and reliability is critical to maximizing efficiency in every step of the refinement process. Whether monitoring ULSD or considering the refinery process strategy, refiners should take care when selecting the methodology for elemental analysis. With better or equivalent precision as identified in the ASTM PTP data above, MWDXRF analyzers utilizing ASTM D7039 methodology offer users the most reliability when evaluating sulfur in automotive fuel, while offering significant advantages in measurement time and ease of use.
Product Highlight: Sindie +Cl
Two Critical Elements with One Instrument
Sindie® +Cl is a two-in-one instrument enabling trace analysis of both sulfur and chlorine with one analyzer. It is the ideal solution to certify sulfur levels in finished products, assess chlorine for corrosion mitigation, and optimize process parameters.
