- Analyzers
- Optics & Sources
- Technologies
- Support
- About
Automatic Matrix Correction for C/H Ratio in Sulfur Analysis Using ASTM D4294 and ISO 8754
BACKGROUND
Recent international trends across a majority of fuel types have focused on lowering specifications for total sulfur. These changes in regulation are in response to public health and environmental concerns. Examples include:
- The International Maritime Organization’s announcement that MARPOL Annex VI, a regulation intended to control airborne emissions from ships, will reduce the total limit on sulfur content of fuel oil used on ships from 3.5 wt% to 0.5 wt% by January 1, 2020.
- In India, all automotive diesel and gasoline was transitioned to Bharat IV with a 50 ppm maximum sulfur in April 2017
As with any method, it is important to consider potential interferences. In this paper, we will discuss automatic correction for matrix differences due to differences in carbon to hydrogen (C/H) ratio of calibration samples (white oils) and measurement samples (such as fuel oil, automotive diesel and gasoline).
CHALLENGE
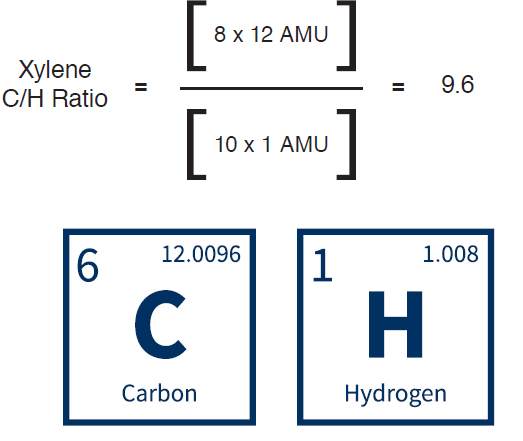
Methods such as ASTM D4294 and ISO 8754 expose unknown samples to X-rays that create fluorescence characteristic of the sulfur contained in the sample. A detector measures the intensity of this characteristic fluorescence, which is then compared to a calibration curve created by measuring a set of samples with certified concentrations of sulfur. However, these methods state that if the ratio of carbon to hydrogen (C/H) of the unknown sample is significantly different from the material that was used to calibrate, then significant bias in the result may be seen. The reason that samples have differing C/H ratios is that many samples are not pure chemicals; pure chemicals, like xylene, have a fixed carbon and hydrogen content. C/H ratios for pure chemicals are easy to calculate if you know the molecular formula. For example, xylene has 8 carbons and 10 hydrogens per molecule. Since carbon has an atomic mass of ~12 AMU and hydrogen is ~1 AMU, the C/H ratio is calculated by multiplying the atomic mass of each element by the number of atoms of that element, and dividing the result for carbon by the result for hydrogen. For xylene, this calculates to a C/H ratio of 9.6. See equation below.
However, samples such as fuel oil and automotive diesel and gasoline, are complex samples with varying aromatic, olefin, and paraffinic content which is more complex than a pure chemical. These sample types, due to differing chemical components, will in turn have variations in C/H ratio between sample types. Examples of typical C/H ratios of common hydrocarbon materials are shown in Table 1.
XYLENE CHEMICAL FORMULA | C8H10
Carbon Atomic Mass = 12 AMU
Hydrogen Atomic Mass = 1 AMU
| Table 1: Typical C/H Ratios of Common Hydrocarbon Samples | |||||||
|---|---|---|---|---|---|---|---|
| ISOOCTANE | 5.3 | KEROSENE | 6 | ||||
| FUEL OIL | 7 | CRUDE OIL | 6 - 8 | ||||
| GASOLINE | 6.1 | XYLENE | 9.6 | ||||
| DIESEL FUEL | 6.1 | MINERAL OIL | 5.6 | ||||
The typical C/H ratios provided in this table are estimated values.
There are two common approaches to avoid the bias results due to mismatched C/H ratios:
- Create a calibration curve using a material that matches the C/H ratio of the sample to be tested. This technique is effective at eliminating the bias due to C/H ratio differences, but it has other limitations. Maintaining separate calibration curves using different sample types requires additional time to calibrate the instrument, added cost in purchasing or preparing calibration standards to create more curves, and requires that the C/H ratio is known before measuring the sample to determine the correct calibration curve to use. Additionally, samples like crude oil can have different C/H ratios if sourced from different locations.
- The second approach uses software with automatic C/H ratio correction, which analyzes the X-ray spectrum of the sample and corrects for the difference. This software is available with XOS’ Petra analyzer series (Petra 4294 and Petra MAX).
SOLUTION
XOS’ Petra analyzer series use information from the deconvolution of the elastic and inelastic X-ray scattering within the sample spectrum to determine the needed correction factor. This ensures that the C/H ratio differences between calibration materials and samples measured do not result in biased results.
APPLICATION STUDY
To demonstrate the capability of Petra analyzers to automatically correct for differences between C/H ratio in calibration standards and materials with different C/H ratios, the following study was conducted:
- A Petra 4294 instrument was calibrated using a single calibration curve from 10 ppm to 6.0 wt% sulfur in mineral oil standards following ASTM D4294 and ISO 8754 methods
- Certified reference materials of different matrices at two different concentrations were obtained:
- 100 ppm Sulfur
- Mineral Oil
- Xylene
- 0.5 wt% Sulfur
- Mineral Oil
- Crude Oil
- 100 ppm Sulfur
- Ten separate aliquots of each reference material were prepared by transferring 7 mL of sample to a standard XRF cup and covered with a 3.6 micron Mylar film
- Samples containing 100 ppm sulfur were analyzed for 300 seconds
- Samples containing 5000 ppm sulfur were analyzed for 100 seconds
- Results reported are from a Petra 4294, which utilizes automatic C/H ratio correction software
The results of this study are shown in Table 2. For both concentration ranges studied (100 ppm and 0.5 wt%), a mineral oil reference material was used as a control sample. The mineral oil used in this study had a C/H ratio of 5.6. Since the instrument was calibrated using mineral oil calibration standards, any bias present in the control sample would not be due to differences in C/H ratio. The relative bias for both mineral oil concentrations was below the 1% uncertainty specified by the reference material manufacturer. The 100 ppm sulfur in xylene sample showed a relative bias of 0.24%, which is also less than the 1% uncertainty specified in the reference material certificate. This result demonstrates that even with a large difference in C/H ratio between the calibration material (5.6) and sample type (9.6), no appreciable bias was observed in the results. Additionally, the data for the 0.5 wt% sulfur in crude oil sample demonstrated bias below the 1% uncertainty. The C/H ratio of this crude oil sample was unknown, but typical crude oil C/H ratios are in the range of 6 to 8.
| Table 2: Sulfur C/H Ratio Study Using Petra 4294* | |||||||
|---|---|---|---|---|---|---|---|
| Concentration | 100 ppm | 100 ppm | 0.50 wt% | 0.50 wt% | |||
| Matrix | Mineral Oil | Xylene | Mineral Oil | Crude Oil | |||
| C/H Ratio | 5.6 | 9.6 | 5.6 | Unknown | |||
| Repeat | Result (ppm) | Result (ppm) | Result (wt%) | Result (wt%) | |||
| 1 | 100.5 | 102.2 | 0.494 | 0.504 | |||
| 2 | 101.5 | 103.6 | 0.498 | 0.502 | |||
| 3 | 99.2 | 101.1 | 0.498 | 0.500 | |||
| 4 | 102.8 | 95.5 | 0.499 | 0.503 | |||
| 5 | 99.0 | 101.8 | 0.497 | 0.502 | |||
| 6 | 103.6 | 101.5 | 0.496 | 0.503 | |||
| 7 | 104.4 | 98.8 | 0.500 | 0.501 | |||
| 8 | 99.0 | 99.4 | 0.498 | 0.500 | |||
| 9 | 97.5 | 100.3 | 0.501 | 0.505 | |||
| 10 | 101.2 | 98.2 | 0.500 | 0.500 | |||
| Average | 100.87 | 100.24 | 0.498 | 0.502 | |||
| Standard Deviation | 2.25 | 2.34 | 0.002 | 0.002 | |||
| RSD% | 2.2 | 2.3 | 0.4 | 0.35 | |||
| Relative Bias (%) | 0.87 | 0.24 | -0.38 | 0.40 | |||
*Both Petra 4294 and Petra MAX offer automatic C/H ratio correction
CONCLUSION
This study demonstrates that Petra analyzers successfully correct for C/H ratio bias using mathematically modeled C/H ratio correction specified in ASTM D4294 and ISO 8754 methods. Utilizing the most advanced optics technology, Petra analyzers deliver accurate measurements across various hydrocarbons without the need to set up and maintain multiple calibration curves to compensate for C/H ratio differences.